NEWS / AI TECHNOLOGY
25 November 2020
In this article, Artefact’s Senior Data Scientists Kasra Mansouri and Camille Le Gonidec explain how to create a data science product with limited data and high business constraints. Find out how they were able to reduce product stock outs in hypermarkets with Time Series modelling.
Problem statement
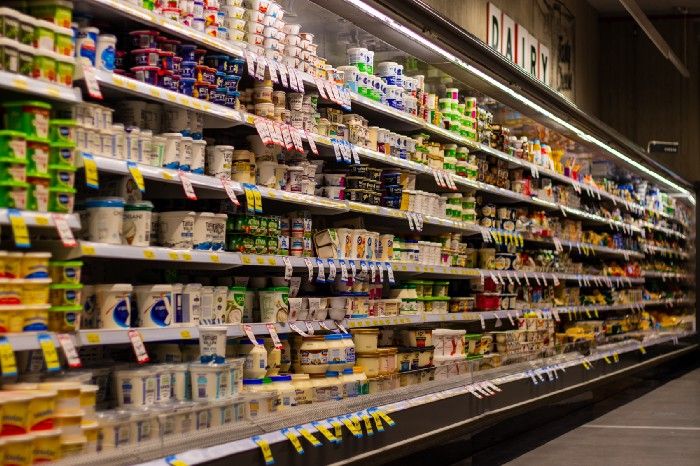
We have all felt that Sunday morning frustration when we cannot find our favourite cereal or soda on the shelf of our local store. Indeed, shelf stock-outs are a major pain point for retail stores: it’s not only a lost opportunity of sales but also a drop in customer satisfaction, who will be more likely to change their store.
Two phenomena mainly cause a shelf to run out of stock :
- The store doesn’t have the given product i.e. even the store warehouse is empty of the product. This can either be caused by under-estimated customer demand or logistical problems.
- The store has the product in stock but the shelf is empty. The shelves usually get filled every morning but there is no employee whose specific task is to take care of their stock during the day. Spotting a shortage by passing by the shelf can be sustainable for small shops but becomes an issue for hypermarkets considering their size. Some shelves end up empty (while inventory level is positive) until an employee spots it or until next morning shelving.
We are going to tackle this second type of stock-outs here since our goal was to help a hypermarket’s employees spot the shelf stock-outs during the day so that they could correct them and restart selling the product. We spent a lot of time in the field to understand our user’s pain points and design the best solution to answer them.
We found out the best option for operational teams would be to receive a daily alert around 2:00 pm (no need for real-time), with a list of out-of-shelf articles they should go and correct.
But how can we spot shelf stock-outs without any visual clue? Indeed, the installation of cameras or visual sensors would be too costly and we cannot ask our staff to “go and check” the shelf status every day to collect data. Our major challenge lies in the fact that there is no historical data available on shelf stock-outs (the only information we have is global stock level at the end of the day), therefore we can only rely on a restricted set of features: real-time sales, item’s attributes and store’s characteristics.
Proposed approaches
As explained above, the main challenge we faced was the absence of labelled data for shelf stock-outs, which prevented us from adopting the initial ML approach we had in mind. Therefore, we considered an alternative approach to build our detection model.
Time Series prediction of hourly sales
Our first alternative approach consisted of detecting sales anomalies (unusually low sales) by predicting hourly sales of products and then comparing them to the actual ones.
The idea behind that is to estimate/predict the regular sales quantity that we expect a product to have when there are no “anomalies” in the store, then compare them to its real sales and raise an alert if the difference is “huge”. Hence, by applying our model every day at 2.p.m we would predict every product’s sales until 2.p.m and then detect anomalies by comparing each product’s real sales with our estimates.
As a starting point, we developed a simple Moving Average model. For each hour, the model would make its predictions by taking an average of the product’s sales on the same hour during the last 30 days. We would then compare this value to the actual sales of the product during that hour, if the following inequality is verified then we would raise an out of stock alert.

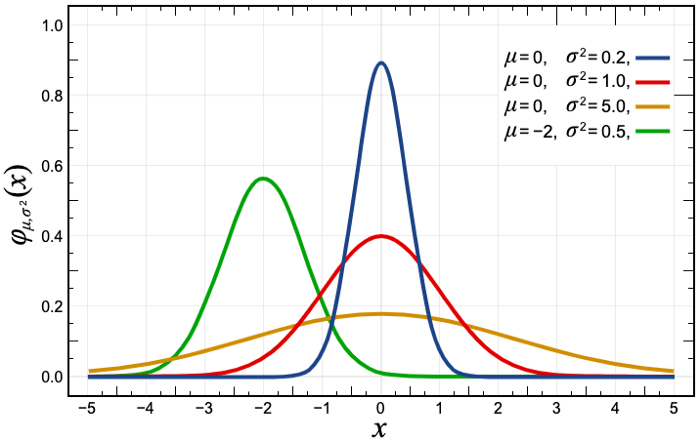
This approach is based on the assumption that the products’ hourly sales follow a Normal distribution and aims to raise alert on products outside of the 95% of the confidence interval.

And that is not the case at all! In fact, we have very little Time Series signal if we looked at hourly sales in a store and that is simply because the majority of products have 0 sales for several hours during the day, thus the model would predict a close to 0 value (by taking average of the past values) for the given hour. Therefore, modelling the hourly sales is clearly not the right way to go.
We tried to slightly modify our approach by predicting daily sales quantity until 2.p.m but we would still have many products for which we did not have enough signal, we call them «low rotation products». This approach would have probably worked on high rotation products like Coca-Cola sodas, water bottles, etc. but our solution needed to work on all the products in a hypermarket, therefore we phased out this approach.
Anomaly detection using Poisson distribution
Our second approach was to try modelling the frequency of sales (and not the quantity), i.e the elapsed time between 2 consecutive sales of a single product.
We performed statistical tests on some products’ sales data and realised that the time between their two consecutive sales follows an Exponential distribution which intuitively makes sense since an Exponential distribution is usually used to model the time between different occurrences of an event.
The logical consequence of this is that we can model a product’s «sales rate» with a Poisson distribution. By sales rate we mean the number of times a product goes through the checkout counter during an hour, regardless of the quantity that has been sold.
Hence, our second alternative approach is to estimate the regular sales rate of each product, which is the lambda parameter of the Poisson distribution, and then compare that to its real daily sales until 2.p.m.
This is a 2-step process:
Calculating the lambda: The lambda is the mean of the Poisson distribution. Thus, to estimate it, we need to calculate the mean of our past data points, i.e the average number of checkouts per hour that the product has had in the past. We took a historical depth of 50 days for our calculation to keep information from the near past. Furthermore, we calculate the lambda for each weekday separately because there is a strong weekly seasonality in product sales in a hypermarket.
Concretely, we gather the sales data of a product from the last 50 days, calculate its sales rate on each day and then calculate the average sales rate for each weekday, therefore our calculation yields 7 lambda numbers, one for each weekday. This calculation is done every week.
Anomaly detection: Every day at 2.p.m, we look for the last time the product was sold. We then calculate the probability (Poisson probability mass function) of having no sales between the last sale and 2.p.m, given the lambda parameter. If the probability is below 1%, then we consider that the product has an unusually low sales rate.
For example let’s imagine a Coca-Cola soda that gets regularly sold every 20 minutes, therefore having a lambda=3, and that today its last sale was at 11 a.m. We calculate Poisson’s probability mass function of having 0 sales for 3 hours knowing that the product gets regularly sold 3 times per hour.

Results
We performed preliminary tests on our Poisson model by trying to measure how good it could estimate sales at 2pm. The model was able to estimate the number of product checkouts by an accuracy of 67%. This result confirmed our intuition that a Poisson model could be the right tool to accurately detect product shortages. Therefore we decided to test our model on the field.
We went to two stores every two days to test and evaluate the precision of our model’s alerts on 3000 products that the stores identified as top priority. An alert would be considered as accurate if the shelf was empty or had less than 10% of its average capacity at the same hour as when the alert was sent. This evaluation phase lasted 2,5 months that resulted in a measured precision rate of 58% (i.e. 58% of our model’s stockout alerts were accurate).
Although the 58% precision might not be shiny the thing to understand is that this solution is very simple to implement (what you only need is to have access to historical sales data and nearly real-time sales data in stores) and can be easily scaled to all the stores to reduce shelf stock-out risks.
You can implement this solution to each store in less than a week and get directly 58–60% precision! Keep in mind that a random classification model would have nearly a 5% precision as in general there are roughly 5% of products to be out of stock on the shelves.
Also, this solution could be part of a bigger product that raise all sorts of alerts with a feedback loop. The alerts that are stock-outs will lead to store employees taking action and refilling the shelves and the ones that are not could be used for further analysis into understanding why the product had an unusually low sales volume. One could also think of building a Machine Learning model that classifies alerts as shelf stock-outs or else since we will be starting to collect labelled data.

Interested in Data Consulting | Data & Digital Marketing | Digital Commerce ?
Read our monthly newsletter to get actionable advice, insights, business cases, from all our data experts around the world!
 BLOG
BLOG


