



When I joined a shared inventory management project at a multinational consumer goods company, the customer service team had no visibility into its resellers’ inventory. The existing dashboard showed where stockouts had occurred in the past. Stockouts and excess stock only surfaced once an order was already late or the product had piled up, too late to react.
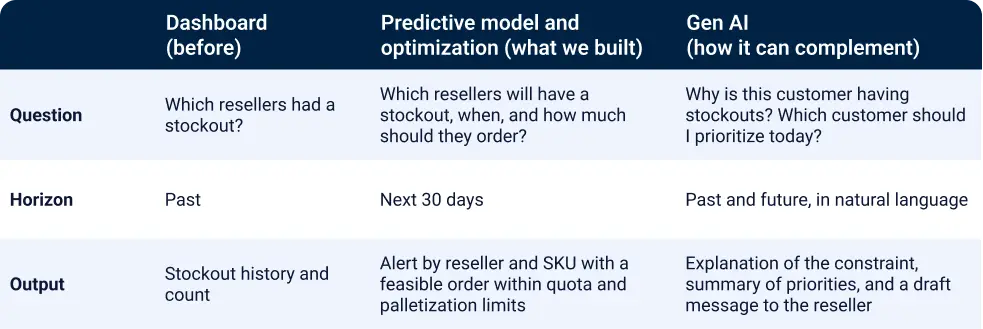
My thesis: a dashboard describes the past, and the commercial gain comes from models that predict the problem and recommend action in time to execute it.
The problem went beyond a lack of visibility. The sales team had to answer two questions for every reseller and SKU: will this reseller need more product? If so, how much can I send? The first requires knowing how much inventory the reseller still has and how much it will sell. The second depends on internal constraints: quotas, inventory at each shipping plant, palletization and the production plan. Cross-referencing all of this by hand, every day, for every reseller and SKU, is not feasible.
What we built. We integrated sell-in, sell-out and reseller inventory data and trained a machine learning model that forecasts sales for the next 30 days. From that forecast, we calculated the likely stockout date for each SKU. We then crossed that date with the constraints: available quota and inventory, palletization, transport lead time and orders already in transit, so that alerts would not go stale. The output is a recommended order for each reseller and SKU, within what is feasible to ship, along with the deadline to place it in time. When an order is not feasible, the tool shows which constraint is blocking it, so the commercial team enters the conversation already knowing the problem.
Power BI is still there, but in a different role. It is no longer the analysis tool. It is the interface to the intelligence behind it, displaying the forecast, risk alerts and recommendations for early action.
The result. We measured the gain through the incremental gross revenue from avoided stockouts: when a predicted stockout is communicated to the reseller and the order is placed in time, we estimate the volume that would have been lost and its sales value. In the year following implementation, the estimated incremental revenue was R$5.09 million brazilian reais.
What was hardest. One of the biggest challenges was not the model, it was the data. Inventory and sales data depend on the resellers, and they had to arrive at the required frequency and in the required format. The frequency is set by contract, but complying with it required follow-up: together with the business team, we set up a process to chase those inputs. We also learned that quota and inventory change throughout the day, so order analysis works best first thing in the morning. After three months of refining the process, we settled into a weekly routine with each reseller, with the tool as the agenda.
Where Gen AI complements. The current solution works well and does not depend on Gen AI, only on traditional AI models such as machine learning and optimizers. But today we could strengthen the interpretation and interaction layer: surface insights on problems that occurred, summarize the day’s priorities in natural language, extend recommendations to the channels commercial teams use most, explain which constraint is blocking an order and draft the message to the reseller. It is an improvement in usability and in support for interpreting and acting on insights, built on a solution that already delivers.
In a nutshell:
How to put this into practice: list the main recurring decisions in your commercial area that today depend on someone looking at a dashboard (replenishment, credit, asset allocation, promotion). Choose the one with a defined owner, frequent data and a loss that can be measured in monetary terms. Now that you have a well-defined problem that can be solved, we can work together on a model that anticipates or optimizes that decision, instead of building yet another dashboard on top of it.