Here are some guidelines to build trustworthy machine learning solutions without falling into ethical pitfalls.
Introduction
The use of machine learning as a means for decision making has now become ubiquitous. Many of the outputs of services we use every day are the result of a decision made by machine learning. As a consequence, we are seeing a gradual reduction in human intervention in areas that affect every aspect of our daily life and where any failure in the algorithmic model’s judgment could have adverse implications. It is therefore essential to set proper guidelines to build trustworthy and responsible machine learning solutions, taking into consideration ethics as a core pillar.
In recent years, ethics in machine learning has seen a significant surge in academic research, with major conferences such as FACCT and AIES, as well as in large tech companies that are putting together fast-growing teams to tackle the ethical challenges.
Ethical AI is a broad subject that covers many topics such as privacy, data governance, societal and environmental well-being, algorithmic accountability, etc. In this article we will mainly focus on the following components of ethics in machine learning: fairness, explainability and traceability. We’ll first discuss what is at stake and why paying attention to ethics is mandatory, then we’ll explore how to frame and develop your machine learning project having ethics in mind and how to follow up on ethics once deployed into production.
Why we should pay attention to ethics
With machine learning algorithms and the set of abstractions and hypotheses underlying them becoming more and more complex, it has become challenging to fully grasp and understand all the possible consequences of the whole system.
There have been several high-profile real-world examples of unfair machine learning algorithms resulting in suboptimal and discriminating outcomes. Upon which, the well-known example of COMPAS. COMPAS was a widely used commercial software that measures the risk of a person to recommit another crime, that was compared to normal human judgment in a study and was later discovered to be biased against African-Americans: COMPAS was more likely to assign a higher risk score to African-American offenders than to Caucasians with the same profile.
In the field of NLP, gender biais was detected in early versions of Google Translate that was addressed in 2018 and more recently.
In the field of credit attribution, Goldman Sachs was being investigated for using an AI algorithm that allegedly discriminated against women by granting larger credit limits to men than women on their Apple cards.
In the field of healthcare, a risk-prediction algorithm used on more than 200 million people in the U.S. demonstrated racial bias.
With no clearly defined framework on how to analyze, identify and mitigate biases the risks of falling into ethical pitfalls may be fairly high. It is thus increasingly important to set proper guidelines in order to build models that produce results that are appropriate and fair, particularly in domains involving people. Building trustworthy AI makes end users feel safe when they use it, and it allows companies to exert more control over its use in order to increase efficiency while avoiding any harm. For your AI to be trustworthy, you actually need to start thinking ethics even before processing data and developing algorithms.
How to think ethics even before your project starts
Ethics must be considered from the beginning of a new project, particularly at the problem framing phase. You should have in mind the targeted end-users as well as the goal of the proposed solution to establish the right analysis and risk management framework to identify the direct or indirect harms that may be induced by the solution. You should ask yourself, in these conditions, could my solution lead to decisions that could be skewed toward a particular sub-group of end-users ?
It’s thus critical to build KPIs to track the methods that carry out your risk management strategy’s efficacy. A robust framework could also incorporate, when possible, ethical risk reduction mechanism.
When dealing with a sensitive subject that has a high risk potential, it is necessary to extend the time allocated to the exploration and build phase in order to inject thorough ethical assessment analysis and bias mitigation strategies.
You must as well establish mechanisms that facilitate the AI system’s auditability and reproducibility . A logic trace must be available for inspection so that any issues can be reviewed or investigated further. This is done by enforcing a good level of traceability through documentation, logging, tracking and versioning.
Each data source and data transformation must also be documented to make the choices made to process the data transparent and traceable. This makes it possible to pinpoint the steps that may have injected or reinforced a bias.
How to include ethics when developing your data project
To include ethics when developing your data project, it is important to include at least three components: fairness, explainability and traceability.
Fairness
The first step in most machine learning projects is usually data collection. Whether going through the data collection process or using an existing dataset, knowledge of how the collection was performed is crucial. Usually, it is not feasible to include the entire target population so features and labels could be sampled from a subset, filtered on some criteria or aggregated. All these steps can introduce statistical bias that may have ethical consequences.
Representation bias
arises from the way we define and sample a population. For example, the lack of geographical diversity in datasets such as ImageNet has demonstrated a bias towards Western countries. As a result of sampling bias, trends estimated for one population may not generalize to data collected from a new population.
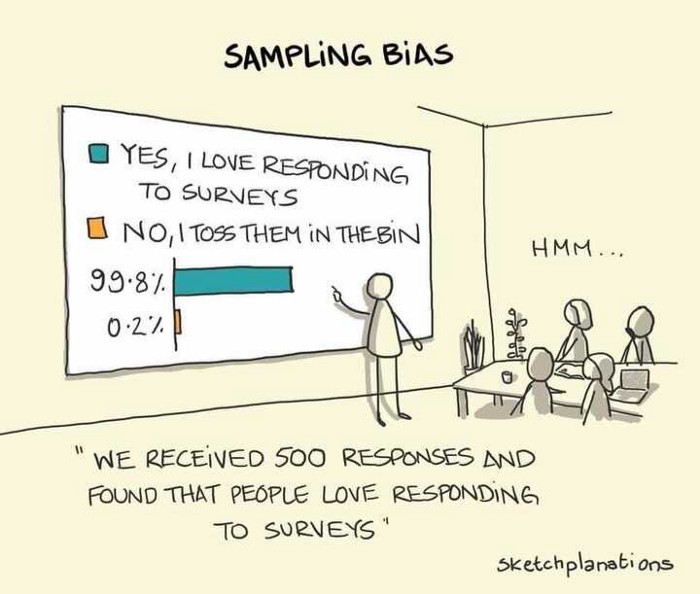
Hence there is a need to define appropriate data collection protocols and to analyse the diversity of the data received and report to the team any gaps or risks detected. You need to collect data as objectively as possible. For example, by ensuring, through some statistical analysis, that the sample is representative of the population or group you are studying and, as much as possible, by combining inputs from multiple sources to ensure data diversity.
Documenting the findings and the whole data collection process is mandatory.
There are in fact many possible sources of bias that can exist in many forms, some of which can lead to unfairness in different downstream learning tasks.
Since the core of supervised machine learning algorithms is the training data, models can learn their behavior from data that can suffer from the inclusion of unintended historical or statistical biases. Historical bias can seep into the data generation process even given a perfect sampling and feature selection. The persistence of these biases could lead to unintended discrimination against certain groups or individuals, which can exacerbate prejudice and marginalization.
Not all the sources of bias are rooted in data, the full machine learning pipeline involves a series of choices and practices along the way, from data pre-processing to model deployment.
It is not straightforward to identify from the start if and how problems might arise. A thorough analysis is needed to pinpoint emergent issues. Depending on the use case, the type of data and the task goal, different methods will apply.
In this section, we will explore some techniques to identify and mitigate ethical biais through an illustrative use case. We’ll first state the problem, then we’ll see how to measure bias and finally we’ll use some techniques to mitigate bias during pre-processing, in-processing and post-processing.
Problem statement
Say you’re building a scoring algorithm in the banking sector to automate the targeting of clients that will benefit or not from a premium deal. You’re given a historical dataset that contains many features on your meaningful data about your customers as well as the binary target “eligible for a premium deal”. Elements of PII (personal identifiable information) have been previously removed from the dataset so there won’t be any privacy issue at stake (on this matter, the google cloud data loss prevention service is a great tool to perform the task of de-identification of your sensitive data).
This use case may seem somewhat fictitious but the problem is close to a real use case we dealt with in the past on a different sector.
Measuring Bias
The first step of the analysis is to explore the data in order to identify sensitive features, privileged value and the favorable label.
Sensitive features (or sometimes called protected attributes) are features that partition a population into groups that should have parity in terms of benefit received. These features can have a discriminatory potential towards certain subgroups. For example: sex, gender, age, family status, socio-economic classification, marital status, etc. and any proxy data derived from them (e.g. geographical location or bill amounts can act as proxies to socio-economic classification as it is observed in some situations that they can be strongly correlated) are sensitive features.
A privileged value of a sensitive feature denotes a group that has had, historically, a systematic advantage.
A favorable label is a label whose value provides a positive outcome that benefits the recipient.During the data preparation phase, steps such as splitting the data, undersampling or oversampling, dealing with missing values and outliers could introduce bias if they’re not carried out carefully. The proportions of missing values or outliers across subgroups on sensitive features can be a first step in identifying bias. Some imputation strategies may introduce statistical bias, for example, imputing the missing values of the client’s age feature by its median.
In our scoring exemple, we drew the graph of how the training data is distributed across genders with regard to the target “eligible for a premium deal” :
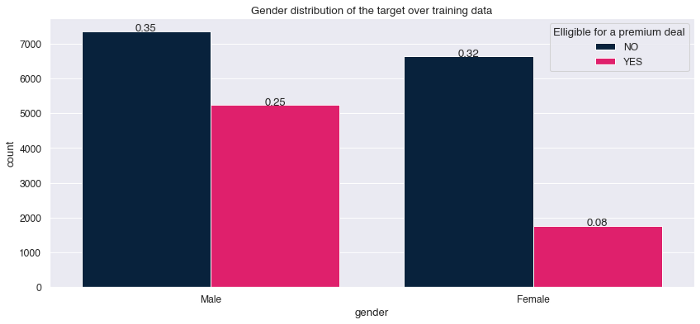
We can see that the distribution of the target is unbalanced in favor of the gender Male. Let us hypothesize that the privilege value is Male where gender is a sensitive feature and the favorable label is “eligible for a premium deal”. Furthermore, this could correspond to a representation bias in the data. In fact, in a case where equity is respected, one could ensure that the distributions in the data are totally balanced or correspond to the distributions in the demographic data.
At this point you might be tempted to simply discard the sensitive features from your dataset but it has been shown that removing sensitive attributes is not necessarily enough to make your model fair. The model could use other features that correlate to the removed sensitive feature, reproducing historical biases. To give an example, a feature A could be strongly correlated to the age of a client so if the data is biased towards a certain age bin (historical bias could result in discrimination on the basis of age in hiring, promotion etc.) this bias will be encoded into feature A and removing the age of a client won’t alleviate the problem. By keeping the sensitive feature in your data, when it’s necessary, you can have greater control over bias and fairness measurements and mitigation.
Bias metrics
There are a variety of fairness definitions and fairness metrics. We can divide fairness into individual fairness and group fairness. Individual fairness gives similar predictions to similar individuals whereas group fairness treats different groups equally.
To achieve group fairness, we want the likelihood of a positive outcome to be the same regardless of whether the person is in the protected (e.g., female) group or not.
One simple group metric is to compare the percentage of favorable outcomes for the privileged and non-privileged groups (in our exemple the gender Male that are “eligible for a premium deal” compared to the gender Female that are “eligible for a premium deal”). You can compute this comparison as a difference between the two percentages which leads to the statistical parity difference metric (also called demographic parity):
For there to be no difference in favorable outcomes between privileged and non-privileged groups, statistical parity difference should be equal to 0.
On the subject of individual fairness metric there is the consistency which measures the degree of similarity of labels for similar individuals using a nearest neighbor algorithm:

We won’t focus on this subject but the interested reader could check this article.
You can use the handy library AIF360 that lets you compute many fairness metrics.
All you have to do is wrap your dataframe into the StandardDataset. AIF360 uses a StandardDataset that wraps a Pandas DataFrame with many attributes and methods specific to processing and measuring ethical biases. You can then use this as an input to the BinaryLabelDatasetMetric class which will compute a set of useful metrics.
| params_aif = { | |
| “label_name” : “eligible_for_a_premium_deal”, | |
| “favorable_classes” : [1], | |
| “protected_attribute_names” : [“gender”], | |
| “privileged_classes” : [[0]] # in our case, 0 is Male and 1 is Female | |
| } | |
| # Create aif360 StandardDatasets | |
| train_standard_dataset = StandardDataset(df=train_dataframe, | |
| **params_aif) | |
| privileged_groups = [{‘gender’: 0}] | |
| unprivileged_groups = [{‘gender’: 1}] | |
| train_bldm = BinaryLabelDatasetMetric(train_standard_dataset, | |
| unprivileged_groups=unprivileged_groups, | |
| privileged_groups=privileged_groups) |
Once measured on our scoring exemple’s training data, we observe a mean statistical parity difference of -0.21 which indicates that the privileged group Male had 21% more positive results in the training data set.
Bias mitigation
Methods that target algorithmic biases are usually divided into three categories:
We used a pre-processing technique on the training data in order to optimize the statistical parity difference. We applied the Reweighing algorithm (more details in this article) that is implemented in AIF360 in order to weight the examples differently in each combination (group, label) to ensure fairness before classification.
RW = Reweighing(unprivileged_groups=unprivileged_groups,
                privileged_groups=privileged_groups)

reweighted_train = RW.fit_transform(train_standard_dataset)
|
The instance weights attribute has changed in order to re-balance the sensitive feature with respect to the target. Doing so, the Reweighing algorithm mitigated the group bias on the training data: a new measure of the statistical parity difference is completely rebalanced from -0.21 to 0.
There are other pre-processing bias mitigation algorithms implemented in AIF360, such as the DisparateImpactRemover which is a technique that edits feature values to increase group fairness while preserving rank order within groups (more info in the following article) or LFR (Learning fair representation) which is a pre-processing technique that finds a latent representation that encodes the data but obscures information about the protected attributes (more info in the following article).
We then trained two classifier models one on the original training data and the other on the reweighed data. We observe that Reweighing had only a weak impact on the performance, losing 1% of F1-score.
We also tried an in-processing algorithm on our example use case: adversarial debiasing that significantly improved the group bias metrics (statistical parity difference was divided by 2) with little deterioration in model performance (about 1% on the F1 score).
There can therefore be a trade-off between performance and bias metrics. Here the deterioration is quite small but in some situations the compromise could be more acute. This information must be brought to light to the team and appropriate stakeholders who can make decisions on how to deal with this issue.
Now that we have trained models we can explore their predictions and investigate for imbalance toward the favorable outcome across genders. There are many tools such as What-if tool or Aequitas that let you probe the behavior of trained machine learning models and investigate model performance and fairness across subgroups.
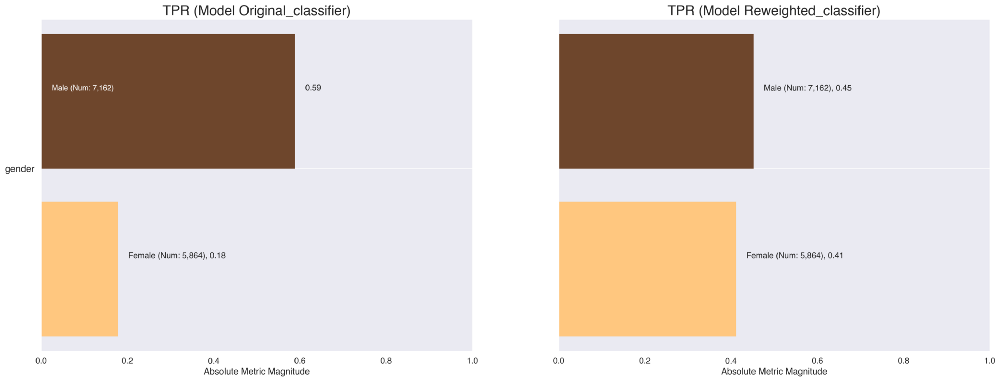
As an illustration, you can use Aequitas to generate crosstabs and visualisations that present various bias and performance metrics distributed across the subgroups. For example we can quickly compare the true positive rates of the classifiers that were trained on the original data and on the re-weighted data. We see that this rate has been balanced and therefore allows for greater gender equity towards the model’s favorable outcome of being eligible for a premium deal.
As a post-processing technique we interacted on the classification threshold. A classification model usually provides us with the probabilities associated with the realization of each class as a prediction. This probability can be used as is or converted into a binary value.
In order to identify the class corresponding to the obtained probabilities, a classification threshold (also called decision threshold) must be defined. Any value above this threshold will correspond to the positive category “is eligible to a premium deal” and vice versa for values below this threshold.
By plotting the performance metric and the bias metric (here 1 – disparate impact) across all classification thresholds, we can define the optimal threshold. This helps us choose the appropriate threshold in order to maximize performance and minimize bias.
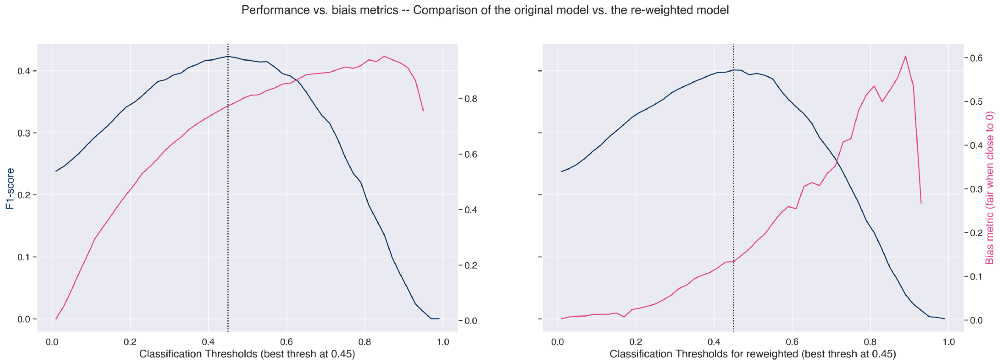
On the left figure we see that if we push the threshold to the left, thereby lowering the performance a bit, we can improve on the bias metric.
Also, as expected, we observe a clear improvement of the group bias metrics on the re-weighted model (right figure) which could be further improved by choosing another classification threshold but at the expense of performance.
Explainability
Another core pillar to build trustworthy machine learning models is the explainability. Explainability is the ability to explain both the technical processes of the AI system and the reasoning behind the decisions or predictions that the AI system makes, therefore being able to quantify the influence of each feature/attribute on the predictions. Using easily interpretable models instead of black-box models as much as possible is a good practice.
There are many methods to obtain explainability of models. These methods can be grouped into 2 categories:
Here we’ll apply a famous post-hoc method, namely SHAP (SHapley Additive exPlanations), for more info we recommend exploring this very comprehensive resource on the subject. Shap is a library that implements a game theoretic approach to explain the output of any machine learning model.
Let’s observe the impact of the Reweighing algorithm on model explainability:
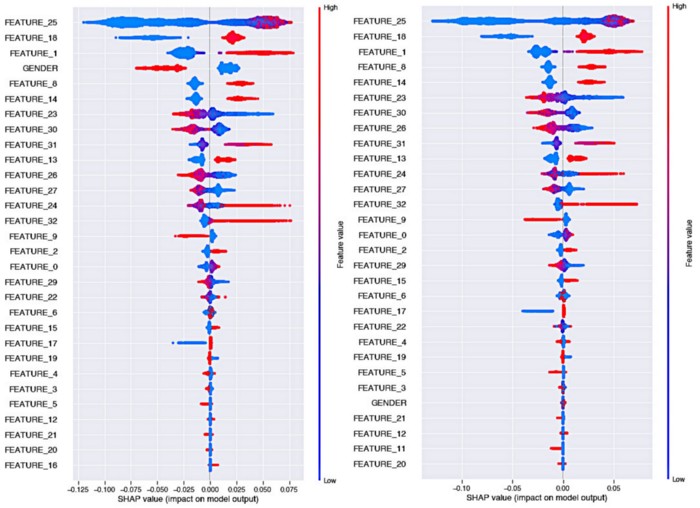
Quick reminder on how to read Shap’s beeswarm plots:
On the left, we have the original model’s explainability where we observe that in this case the gender variable has a very strong predictive power and that the gender Female has an impact that influences the decision towards the “not eligible to a premium deal” target with a big gap with respect to the gender Male.
We can see on the right graph, in this case where the model was trained on the re-weighted data, that the importance of the gender feature has strongly decreased. It is now part of the least important features. Moreover, the influence of the female vs. male class on the prediction of the target is much more balanced (the colors are close to 0 in Shapley value).
Traceability
Another essential aspect in the process of creating trustworthy machine learning algorithms is the traceability of results and good reproducibility of experiments. This makes it easy to identify which version of a model has been put into production so that it can be audited if its behavior causes harm and no longer conforms to the company’s ethical values.
To do this, one must be able to track and record each model version and its associated training data, hyperparameters and results. Several tools can accomplish this task: Mlflow is one great option that allows you to quickly generate a web interface that centralises all runs, while saving your artifacts into the storage of your choice. Each version of the experiment can be tracked with the hash of the associated commit. Each of these versions will contain all the elements recorded by MLflow.
Here is a tool that we’ve open sourced at Artefact that lets you deploy a secure MLflow on a GCP project with a single command.
It is also a good practice to create a FactSheet for each model, which corresponds to a model identity card that summarizes various elements tracing the pre-processing steps, performance metrics, bias metrics etc.
These identity cards are delivered by the data scientists to the model operating teams, allowing them to determine whether the model is suitable for their situation. For more details on the methodology for creating a FactSheet we recommend this article. The FactSheet can also be stored, in tabular form for example, in MLFlow alongside the associated model.
How to follow up on ethics once deployed
Once your model is deployed, you have to make sure that it is used for the purpose for which it was thought, designed and built. Deployment bias occurs when there is a mismatch between the problem a model is intended to solve and the way it is actually used. This frequently happens when a system is developed and evaluated as if it were totally self-contained, whereas in reality it is part of a complex socio-technical system governed by a large number of decision-makers.
Production data can drift over time which can result in algorithm performance degradation that could inject bias. Tracking production data quality and data drift by monitoring the distributions of new data compared to the data used to train the models, should be a step in the production pipeline to raise the proper alerts when necessary and define when retraining is mandatory.
The production pipeline should be designed so that there is a way to turn off the current model or roll back to a previous version.
Conclusion
In this article we’ve presented some good practices and protocols to guide you into building machine learning pipelines that minimise the risk of falling into ethical pitfalls.
This article has barely scratched the surface of the vast subject that is ethical AI and only merely touched on of the interesting tools being developed that are now available.
As we’ve seen, the most logical way to explicitly address fairness problems is to declare a collection of selected features as potentially discriminatory and then investigate through this prism ethical bias. This straightforward technique, however, has a fault in that discrimination can be the outcome of a combination of features that aren’t discriminatory on their own. Moreover, in many cases you won’t have access to any sensitive feature (more on this subject here).
Fairness assessment is a complex task that is dependent on the nature of the problem. Approaching a scoring problem based on tabular data won’t be the same as mitigating bias in natural language processing.
We hope that sharing our perspective and methodologies will inspire you in your own projects ! Thank you for reading, don’t hesitate to follow the Artefact tech blog if you wish to be notified when our next article releases!

 BLOG
BLOG


