

Autor


Dieser Artikel ist der dritte Teil einer Serie, in der wir den Prozess der Protokollierung von Modellen mit Mlflow, deren Bereitstellung auf der Kubernetes-Engine und schließlich deren Skalierung entsprechend den Anforderungen unserer Anwendung durchgehen. Obwohl dieser Artikel unabhängig davon verwendet werden kann, um eine beliebige API-Antwort zu testen, empfehlen wir die Lektüre unserer beiden vorherigen Artikel (Teil1 und Teil2) über die Bereitstellung einer Tracking-Instanz und die Bereitstellung eines Modells als API mit Mlflow. Im Folgenden werden wir uns mit dem Problem der Skalierbarkeit befassen und einige Experimente durchführen, um das Verhalten des k8s-Clusters zu verstehen und Empfehlungen zu geben, wie Sie mit hohen Lasten umgehen können.
Teil 3 - Wie können wir hohe Lasten bewältigen und unsere Anwendung skalierbar machen?
Einführung
In einem klassischen Szenario, in dem ein maschinelles Lernmodell hinter einer Anwendung oder einem Produkt eingesetzt wird, könnten mehrere Benutzer gleichzeitig damit interagieren, um Vorhersagen zu erstellen. Daher ist es wichtig, unsere Infrastrukturkapazitäten zu analysieren und sie entsprechend zu dimensionieren. Dies ist besonders interessant, wenn es um Kubernetes geht, denn es könnte sich auf die Entscheidung auswirken, ob Autoscaling verwendet werden soll oder nicht, auf die maximale Anzahl von Knoten, die...
In diesem Zusammenhang ermöglichen Lasttests die Simulation mehrerer gleichzeitiger oder inkrementeller Anfragen und die Überwachung des Verhaltens der Infrastruktur (Antwortzeit, CPU-Auslastung, Speicherverbrauch usw.), um Ressourcen richtig zu dimensionieren und Engpässe zu vermeiden. Diese Tests werden hier mit einem Tool namens Locust durchgeführt.
Vorbereitung der Umgebung
Die Anforderungen für dieses Hands-on sind im ersten Artikel dieser Serie detailliert beschrieben. Als Zusammenfassung finden Sie hier die wichtigsten Elemente, die wir speziell für diesen Teil benötigen, wobei wir davon ausgehen, dass unser Modell bereits als API auf einem Kubernetes-Cluster (mlflow-k8s) implementiert ist.
Für diesen Teil der praktischen Übung benötigen wir:
Einsatz
1. Erstellen Sie das Locust-Docker-Image und pushen Sie das Locust-Image zu GCR
cd mlflow-serving-beispieldocker build --tag $/locust-tasks:v1
Datei dockerfile_locust .docker push $/locust-tasks:v1
2. Bereiten Sie die Testaufgabe vor
Tasks sind Python-Funktionen, die Locust als Teil des Lasttests auf seinen Workern ausführt, im Beispielcode unter heuschrecken-aufgaben/aufgaben.py müssen wir nur eine POST-Anfrage an die API mit einer data-Zeile senden, um Vorhersagen zu erhalten.

In diesem Codeschnipsel :
Wir können so viele Funktionen wie Tests erstellen, die wir durchführen möchten. Wir können zum Beispiel eine Funktion zum Senden von data-Stapeln hinzufügen. Außerdem können wir die Funktion @Aufgabe() Dekorateur, um den verschiedenen Aufgaben Priorität zu geben.
3. Bereitstellung in Kubernetes
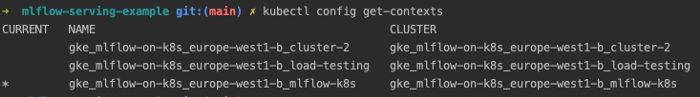
Jetzt ist es an der Zeit, das Image zu verteilen und Locust auf seinem eigenen Cluster auszuführen. Stellen Sie zunächst sicher, dass der Kontext auf dem laden_testen Cluster durch Ausführen von
kubectl config get-Kontexte
kubectl config use-context NAME
Als nächstes können wir unsere Bereitstellungsdatei aktualisieren Bereitstellungen/locust_load_test.yaml durch die Angabe von den Bildpfad auf GCRund das Zeigen der TARGET_HOST an die API-Adresse.
apiVersion: v1
metadata:
Name: Heuschrecken-Meister
Etiketten:
Name: Heuschrecke
Rolle: Meister
spec:
Replikate: 1
Selektor:
Name: Heuschrecke
Rolle: Meister
Vorlage:
metadata:
Etiketten:
Name: Heuschrecke
Rolle: Meister
spec:
Container:
- Name: Heuschrecke
Bild: GCR_REPO/locust-tasks:v1 # Hier ändern
env:
- Name: LOCUST_MODE
Wert: Master
- Name: TARGET_HOST
Wert: ‘http://SERVING_IP:SERVING_PORT’ # Hier ändern
Häfen:
- Name: loc-master-web
containerPort: 8089
Protokoll: TCP
- Name: loc-master-p1
containerPort: 5557
Protokoll: TCP
- Name: loc-master-p2
containerPort: 5558
Protokoll: TCP
-
Art: ReplicationController
apiVersion: v1
metadata:
Name: Heuschrecken-Arbeiter
Etiketten:
Name: Heuschrecke
Rolle: Arbeiter
spec:
Repliken: 30
Selektor:
Name: Heuschrecke
Rolle: Arbeiter
Vorlage:
metadata:
Etiketten:
Name: Heuschrecke
Rolle: Arbeiter
spec:
Container:
- Name: Heuschrecke
Bild: GCR_REPO/locust-tasks:v1 # Hier ändern
env:
- Name: LOCUST_MODE
Wert: Arbeiter
- Name: LOCUST_MASTER
Wert: Heuschrecken-Meister
- Name: TARGET_HOST
Wert: ‘http://SERVING_IP:SERVING_PORT’ # Hier ändern
-
Art: Dienstleistung
apiVersion: v1
metadata:
Name: Heuschrecken-Meister
Etiketten:
Name: Heuschrecke
Rolle: Meister
spec:
Häfen:
- Hafen: 8089
targetPort: loc-master-web
Protokoll: TCP
Name: loc-master-web
- Hafen: 5557
targetPort: loc-master-p1
Protokoll: TCP
Name: loc-master-p1
- Hafen: 5558
targetPort: loc-master-p2
Protokoll: TCP
Name: loc-master-p2
Selektor:
Name: Heuschrecke
Rolle: Meister
Typ: LoadBalancer
Lassen Sie es uns schließlich mit folgendem Befehl einrichten.
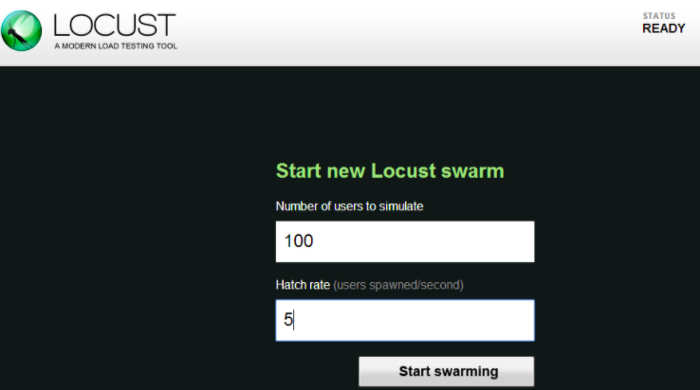
kubectl create -f deployments/locust_load_test.yamlDie Locust-Instanz sollte jetzt hochgefahren sein und ein neuer Load Balancer sollte erstellt worden sein. Wir können seine IP finden, indem wir eingeben kubectl get Dienste und greifen Sie über die LoadbalancerIP:8089 auf die Schnittstelle zu.
Experimentieren
Die Idee ist, Locust zu verwenden, um parallele Abfragen auf unserer Serving-API zu simulieren und das Verhalten des Clusters und die Antwortzeit zu analysieren (Median in grün und 95. Perzentil orange). Dies geschieht zu Lehrzwecken, um zwei Funktionen von Kubernetes hervorzuheben, nämlich die horizontale und vertikale (Auto-)Skalierung.
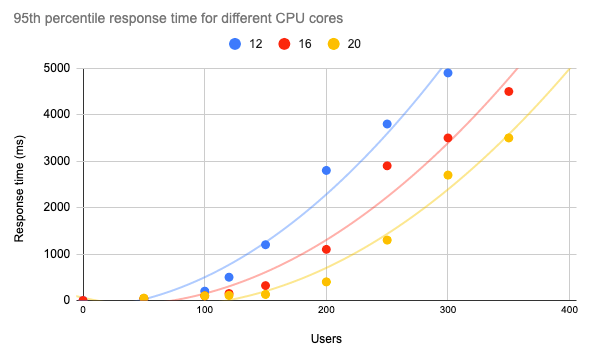
1. Manuelle Skalierung
Im ersten Experiment versuchen wir zu verstehen, wie sich die mehr Schoten haben die unsere Modelle bedienen. Wir beginnen mit einem Pod und versuchen, die Anzahl der Anfragen zu erhöhen. In der Grafik unten können wir 4 Phasen mit unterschiedlichen Konfigurationen und Gebühren unterscheiden.
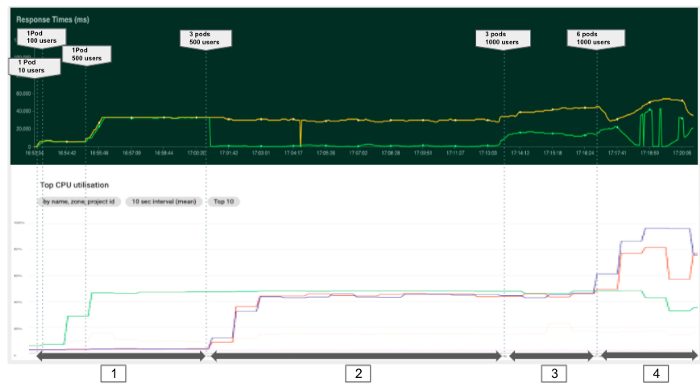
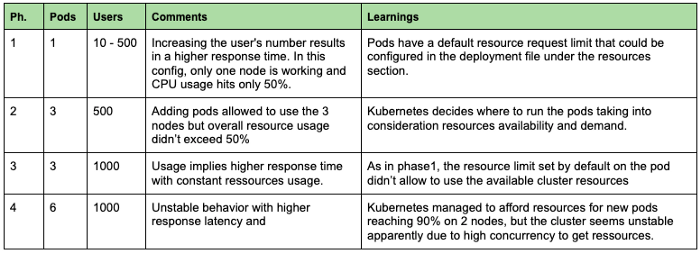
Generell können wir feststellen, dass es wichtig ist, die Ressourcenmetriken (CPU, RAM...) stets zu überwachen, um Engpässe und Konfigurationsprobleme zu erkennen. In unserem Fall konnten wir mit nur einem Pod nicht von der verfügbaren Rechenleistung profitieren. Bei der Bereitstellung einer Anwendung ist es daher wichtig, eine geeignete Anzahl von Pods und genügend Ressourcen pro Pod festzulegen, um die Maschinenauslastung unter Berücksichtigung der im Backend laufenden Systemdienste zu maximieren. Wir empfehlen daher, die CPU-Auslastung der Nodes nicht höher als 80-90% zu setzen.
2. Horizontale automatische Skalierung
Nun, glücklicherweise hat Kubernetes eine Funktion zur automatischen horizontalen Skalierung um die CPU-Auslastung automatisch zu überwachen und bei Bedarf neue Pods zu erstellen, um die Belastung zu verteilen. Dies kann einfach durch den folgenden Befehl aktiviert werden.
kubectl autoscale deployment mlflow-serving --cpu-percent=80 --min=1 --max=12Wir können dann die Anzahl und den Status der Pods mit kubectl get hpa mlflow-serving, analysieren Sie die Reaktionszeit des Clusters und den Ressourcenverbrauch.
Das Ziel des folgenden Experiments ist es, zu beobachten, wie Kubernetes automatisch Pods hinzufügen kann, um die Ressourcennutzung zu optimieren und eine bessere Reaktionszeit zu erreichen. Wir können dieses Experiment in drei Phasen unterteilen, wie in der Grafik unten dargestellt.
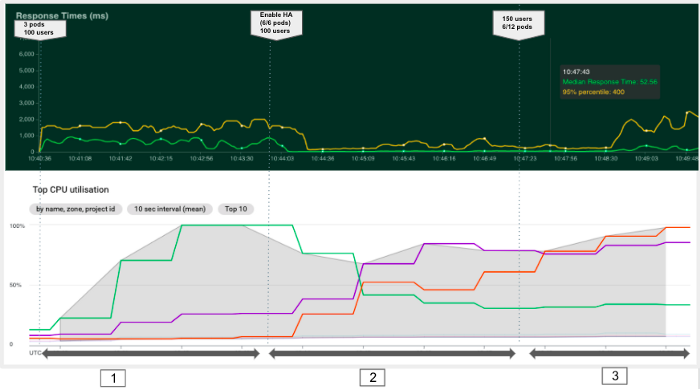
In diesem zweiten Experiment konnten wir feststellen, dass die horizontale automatische Skalierung es uns ermöglicht, die Antwortzeit zu verringern, indem wir neue Pods erstellen und mehr Cluster-Ressourcen zuweisen. Bei Erreichen der Clusterkapazität (Phase3) bleiben neue Pods jedoch in einem ausstehenden Status und unsere Antwortzeit steigt wieder an.
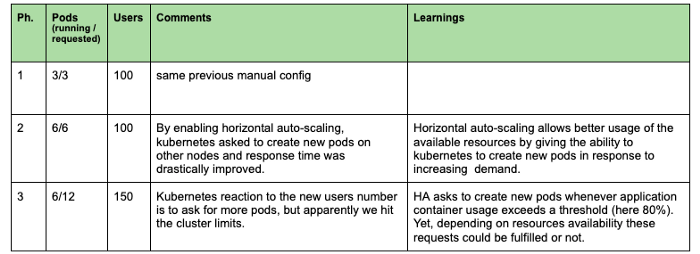
3. Vertikale Autoskalierung
In einer solchen Situation können wir eine andere Kubernetes-Funktion erkunden, die als vertikale Auto-Skalierung die darin besteht, mehr Knoten zuzuweisen, wann immer dies erforderlich ist. Diese Funktion kann mit dem folgenden Befehl aktiviert werden, der die Anzahl der minimalen und maximalen Knoten angibt, die Kubernetes zuweisen kann.
gcloud container clusters update mlflow-k8s
--autoskalieren-aktivieren --min-Knoten 3 --max-Knoten 5 --Knoten-Pool POOL_NAME
In diesem letzten Experiment, das in der Grafik unten zusammengefasst ist, ermöglichte die Aktivierung der vertikalen Autoskalierung Kubernetes, automatisch zwei neue Knoten hinzuzufügen und neue Pods zu erstellen, um die Last zu verteilen und eine niedrigere Reaktionszeit zu gewährleisten. Tatsächlich dauerte es etwa 1 Minute, bis Kubernetes den Bedarf erkannte und die Ressourcen anlegte (Phase 2). Außerdem gelang es Kubernetes bei geringerer Last (Phase 3), die beiden neuen Knoten durch das Töten von Pods freizugeben und den Cluster in etwa 15 Minuten auf ein Minimum von drei Knoten zu verkleinern.
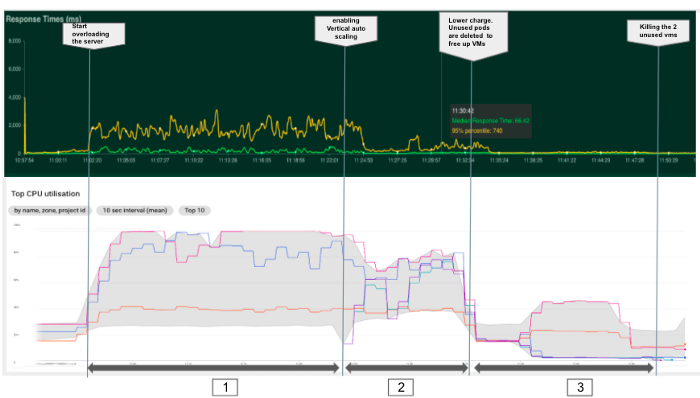
4. Schätzung der Clustergröße
Nachdem wir nun verstanden haben, wie sich Kubernetes als Reaktion auf verschiedene Ladestufen unter Verwendung der vertikalen und horizontalen Autoskalierungsfunktionen verhält, besteht der letzte Schritt darin, Leistungstests mit verschiedenen Ressourcen durchzuführen, wobei die Anforderungen unserer Anwendung und die geschätzte Anzahl ihrer Benutzer berücksichtigt werden. Stellen wir uns vor, dass unsere 95. Perzentil-Antwortzeit unter 1 Sekunde liegen sollte, um unsere SLA-Anforderungen zu erfüllen. In diesem Fall können wir das unten stehende Diagramm mit der API-Antwortzeit für verschiedene Kernzahlen erstellen und uns einen Eindruck von der Leistung unserer Anwendung unter verschiedenen Bedingungen verschaffen.
Insbesondere für unser ML-Modell, das mit Mlflow bedient wird, können wir etwa 120 gleichzeitige Benutzer auf einem Kubernetes-Cluster mit 12 Kernen haben und eine Antwortzeit von unter 1 Sekunde garantieren.
Fazit
In einer Reihe von Artikeln haben wir den gesamten Prozess der Bereitstellung einer Mlflow-Tracking-Instanz und der Bereitstellung eines Modells als API auf der Kubernetes-Engine durchlaufen und dabei die Vorteile seiner Fähigkeit genutzt, leicht zu skalieren und hohe Lasten zu bewältigen. Wir haben auch mit zwei interessanten Funktionen experimentiert, die Kubernetes bietet, nämlich der horizontalen und vertikalen Autoskalierung, und gezeigt, dass es immer interessant ist, unsere Ressourcen zu überwachen, um sicherzustellen, dass wir sie effizient nutzen. Schließlich haben wir gezeigt, wie wir unsere Anwendung testen und Entscheidungen bezüglich der Infrastruktur auf der Grundlage ihrer Reaktion auf verschiedene Testszenarien treffen können.