


NOTICIAS / TECNOLOGÍA AI
25 de noviembre de 2020
En Artefact somos tan franceses que hemos decidido aplicar el aprendizaje automático a los cruasanes. Este primer artículo de dos explica cómo hemos decidido utilizar Catboost para predecir las ventas de “viennoiseries”. Las características más importantes que impulsaron las ventas fueron las últimas ventas semanales, si el producto está en promoción o no y su precio. Le presentaremos algunas bonitas características de ingeniería, como la canibalización y por qué a veces es necesario actualizar la variable objetivo.
¿De qué se trata?
En Artefact somos tan franceses que hemos decidido aplicar el aprendizaje automático a los cruasanes. Este primer artículo de dos explica cómo hemos decidido utilizar Catboost para predecir las ventas de “viennoiseries”. Las características más importantes que impulsaron las ventas fueron las últimas ventas semanales, si el producto está en promoción o no y su precio.
Le presentaremos algunas bonitas características de ingeniería que incluyen la canibalización y por qué a veces es necesario actualizar la variable objetivo. Elegimos como métricas de evaluación la Precisión de Pronóstico y el biais. Nuestro segundo artículo explicará cómo pusimos este modelo en producción y algunas buenas prácticas de ML Ops.
¿Para quién?
- Data Científico, Ingeniero ML o Data amantes
¿Para llevar?
- Algoritmos de refuerzo para la predicción de series temporales
- Cómo responder a un problema de previsión con ruido data
- Cómo gestionar las limitaciones operativas en la producción
Contexto
Recientemente hemos estado trabajando en un tema realmente interesante y desafiante para un gran minorista en Francia: Cómo predecir la demanda diaria de productos frescos perecederos como la bollería, incluidos nuestros queridos cruasanes.
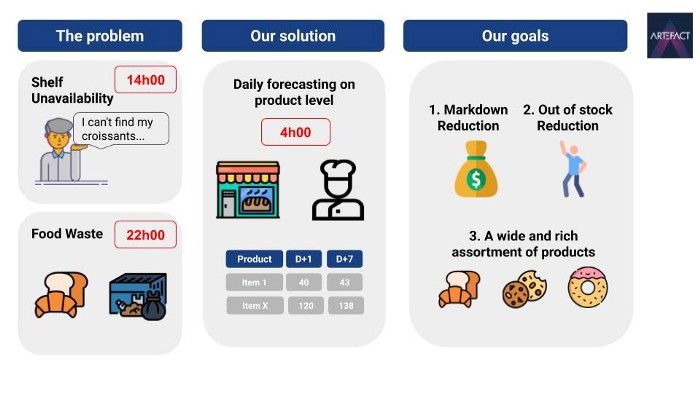
Este minorista se enfrentaba a un problema clásico de la cadena de suministro: cada día sus panaderos tienen que hornear una cierta cantidad de productos frescos y perecederos: cruasanes, panes de chocolate, baguettes, tartas de limón, etc. La mayoría de estos productos no duran más de un día, si no se venden se consideran ingresos perdidos. Por otro lado, si no hay disponibilidad en los estantes durante el día, se traducirá en consumidores descontentos y en una pérdida de dinero. El reto consiste en predecir a nivel diario, con siete días de antelación, la cantidad de cada producto perecedero para cada tienda. El objetivo de este proyecto es mejorar la disponibilidad en los estantes y reducir al mismo tiempo el desperdicio de alimentos.
Para predecir las ventas con unos días de antelación, ya se utilizaba una solución interna que utilizaba medidas estadísticas sencillas. Sin embargo, tras reunirnos con los responsables de la panadería, comprendimos que había un claro margen de mejora aprovechando más data y características como los efectos de la estacionalidad, el tiempo, las vacaciones, los efectos de la sustitución de productos, etc. Así pues, decidimos utilizar la solución actual como línea de base y probar algoritmos más recientes para mejorar la precisión de la previsión.
Y para concluir esta introducción, una ilustración del reto y de lo que queremos conseguir.
Desarrollo de modelos
Ahora que tenemos un problema bien definido y algunos objetivos que alcanzar, por fin podemos empezar a escribir un buen código python en nuestros cuadernos: ¡que empiece la diversión!
Solicitud Data
Como en cualquier proyecto científico data, todo empieza con data. Por experiencia, le recomendamos encarecidamente que solicite el data lo antes posible. No sea tímido a la hora de pedir muchos data y para cada fuente de data asegúrese de identificar a un referente, alguien con quien pueda ponerse en contacto fácilmente y plantear sus preguntas sobre la colección de data o sobre cómo se estructura el data.
Gracias a las distintas reuniones pudimos elaborar una lista de los data que podíamos utilizar:
- Transaccional data incluido el precio de los productos.
- Promociones: una lista de todas las promociones futuras y sus precios asociados.
- Información sobre el producto: diferentes características relacionadas con los productos.
- Información sobre las tiendas: ubicación, tamaño de las tiendas, competidores.
- Tiempo data.
- Residuos data: al final de cada día, cuántos productos se tiraron.
Análisis exploratorio Data (EDA) y detección de valores atípicos
Una vez recogida la data, empezamos a hacer algunos análisis. ¿Existe estacionalidad en mi data? ¿Una tendencia? ¿Cuántos productos tengo? ¿Son coherentes a lo largo del tiempo? ¿Hay productos estacionales?
Al trazar las diferentes series temporales, también detectamos algunas características interesantes:
- Estacionalidad a lo largo del año, pero también durante la semana.
- Precios y si el producto está en promoción o no.
- Canibalización de productos y ventas diferidas durante la falta de existencias.
- El patrón de ventas difiere de una tienda a otra.
Tenga en cuenta que hemos creado diferentes características relacionadas con la fijación de precios. El precio absoluto, pero también los precios relativos en comparación con otros productos de la misma subfamilia, familia o tienda. El precio relativo es una forma de cuantificar la canibalización de precios entre productos. También creamos características que traducen la variación del precio de un producto a lo largo del tiempo.
Para tareas de predicción tan realistas, el diablo está en los detalles y es realmente importante buscar valores atípicos y anomalías, tomarse el tiempo necesario para hacer crujir su data.
Pero primero, ¿por qué deberíamos preocuparnos por la detección de valores atípicos? Por muchas razones, puede indicar un mal data, errores en los ETL, procesos empresariales que desconocía. En segundo lugar, es muy probable que afecte a su algoritmo y a la parte de inferencia, por lo que es sin duda una parte importante del desarrollo.
Puede detectar valores atípicos en distintos momentos del proyecto, ya sea durante el análisis exploratorio data (EDA) o analizando los mayores errores de sus modelos.
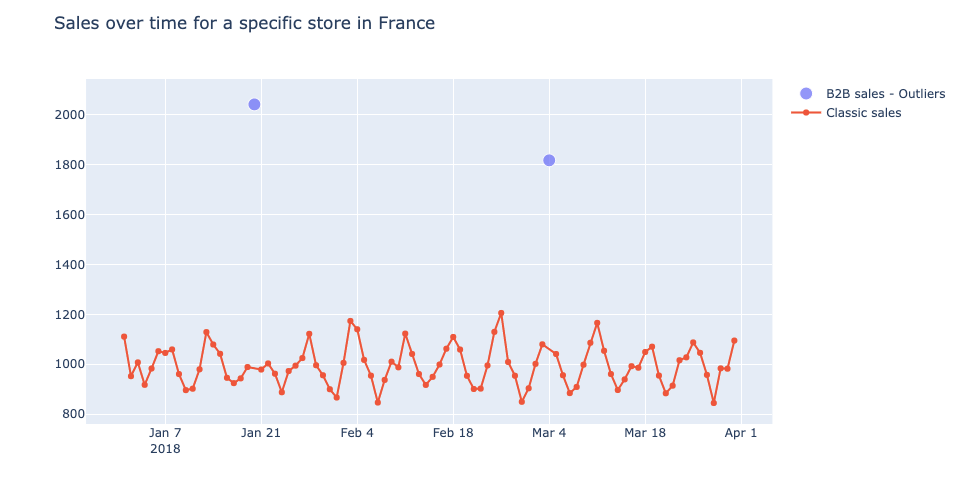
Al realizar el EDA, detectamos algunos data extraños, como las ventas B2B, por ejemplo 1.800 ventas de un solo artículo en un solo recibo de compra. Valores atípicos relacionados con la fijación de precios, en su mayoría debidos a errores manuales de la cajera: ¡precios negativos o un cruasán que costaba 250 euros!
Nos dimos cuenta de que a veces nuestras predicciones estaban totalmente equivocadas los primeros días de los periodos de promoción. Después de algunos análisis nos dimos cuenta de que se debía a que la promoción se lanzaba un día antes o después del día oficial. De hecho, a veces el gestor se tomaba alguna libertad y decidía cambiar el inicio o el final de las promociones. Estos cambios pueden detectarse y fijarse en el conjunto de entrenamiento data pero pueden dar lugar a grandes errores de predicción. En efecto, las promociones pueden alcanzar volúmenes de 4 a 5 veces mayores que en caso de no promoción.
Aquí tiene una lista de otros ejemplos interesantes de procesos y mecanismos que hemos descubierto gracias a este análisis y que puede encontrar en sus proyectos:
- El surtido no siempre es coherente a lo largo de los días debido a limitaciones operativas, errores, gestión de existencias.
- En el caso de algunas fuentes data, las fechas indicadas eran los días en que se cargó el data, por lo que es necesario eliminar un día para obtener el día real.
De la predicción de ventas a la predicción óptima de ventas
Un reto nos llevó a actualizar nuestra variable objetivo. A veces, debido a una influencia inesperada o a una mala previsión, el departamento esperaba una escasez de productos antes del final del día. Entonces pueden producirse dos fenómenos: el cliente al no poder encontrar su producto no compra nada, o compra un bien similar. Basándonos en el histórico data, dedujimos algunas leyes de distribución (estadísticas básicas) que nos ayudaron a modelizar este impacto y actualizamos nuestra variable objetivo para no predecir las ventas históricas sino las ventas óptimas de un producto concreto.
Esta actualización de la variable objetivo es delicada porque es realmente difícil saber si la actualización ha tenido sentido. ¿Mejoró realmente la calidad del data o la empeoró? Una forma de cuantificar nuestro impacto fue tomar las ventas sin ruptura de existencias y crear una falsa escasez, por ejemplo, eliminar todas las ventas después de las 5 ó 6 de la tarde y luego intentar reconstruir las ventas. Este método nos ayuda a volver a un problema clásico supervisado que podemos evaluar objetivamente.
Como resultado, pudimos predecir las ventas óptimas y evitar que nuestro algoritmo aprendiera patrones de escasez.
Nuestros modelos
Después de haber limpiado correctamente nuestro data, por fin podemos probar y ensayar algunos modelos.
Tiene muchas posibilidades diferentes para abordar un problema de previsión: enfoques estadísticos clásicos (SARIMA, Suavizado exponencial, Profeta, etc.), enfoques de aprendizaje automático (Regresión lineal, Algoritmos de refuerzo) o Aprendizaje profundo (RNN, LSTM, CNN). Cómo elegir el enfoque adecuado es una cuestión delicada, he aquí algunos elementos que nos ayudaron a elegir:
- No una, sino muchas series temporales: ~10 000
- Series temporales irregulares: puede ocurrir que no haya ventas durante algunos días debido a decisiones del gestor o a limitaciones comerciales u operativas.
- Las promociones tienen un gran impacto y no son estacionales ni cíclicas.
- Observamos una enorme correlación entre las ventas en J-0 y las ventas de en J-7, J-14, J-21 para los artículos por tienda y el estado de estar en promociones o no.
- Los factores exógenos data influyen en las ventas: precios, días especiales, etc.
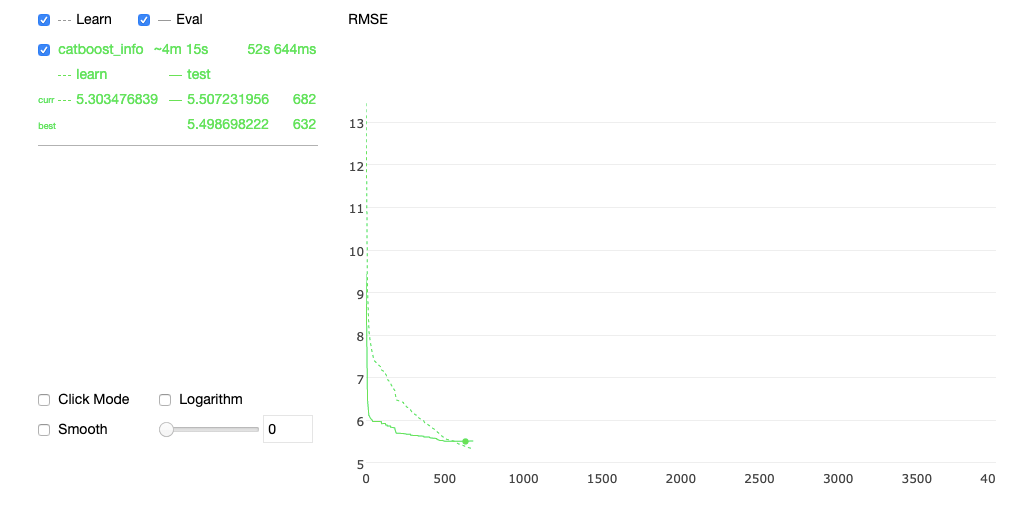
Por estas razones, decidimos elegir Catboost como modelo. Catboost tiene muchas ventajas, como el manejo nativo de valores categóricos y ausentes, puede manejar muchas características, se escala bien y puede inferir muchas series temporales dentro del mismo modelo. Además, proporciona un bonito gráfico durante el entrenamiento y se integra muy fácilmente con SHAP para la importancia del rasgo.
He aquí, por ejemplo, una captura de pantalla del gráfico interactivo del algoritmo durante su entrenamiento:
Sin embargo, uno de los inconvenientes de los enfoques de ML puro es la necesidad de codificar uno mismo todas las características, especialmente las relacionadas con el tiempo. Sin una sólida ingeniería de características, estos algoritmos serán incapaces de captar los patrones temporales. Además, sólo pueden inferir un marco temporal fijo, a diferencia de Sarima o Prophet, en los que puede especificar el número de días a pronosticar mediante el parámetro periodos.
Por último, debe tener mucho cuidado con las fugas de data, especialmente cuando construya su función de retardo.
Una de las principales características no era el desfase semanal, sino la media de los desfases: D-7, D-14, D-21, ... etc las últimas seis semanas. De hecho, la característica no regular de nuestra serie temporal mezclada con el uso de la promoción de vez en cuando induce una estacionalidad difusa, de ahí el uso de una media. Es importante observar que el mero uso de esta media como modelo único ya ofrece un rendimiento realmente bueno.
Un modelo frente a muchos modelos
En resumen, utilizamos un algoritmo Catboost, para predecir todas nuestras 10 000 series temporales, para cada producto y cada tienda. Pero, ¿y si un artículo tiene un patrón de ventas realmente particular, o una tienda específica? ¿Podría el algoritmo identificar y aprender este patrón?
Estas cuestiones nos llevan a preguntarnos, ¿deberíamos agrupar nuestros productos, tiendas y entrenar un algoritmo por agrupación? Aunque el uso de algoritmos de árboles de decisión debería hacer frente a este reto, observamos limitaciones en algunos casos concretos.
Los algoritmos de refuerzo son algoritmos iterativos, basados en aprendices débiles que se centrarán en sus mayores errores. Evidentemente, está un poco simplificado, pero me sirve para señalar una de sus limitaciones. Si no ha normalizado su variable objetivo, su algoritmo “sólo” se centrará en los productos con grandes errores, que serán probablemente los que tengan mayores ventas. Como resultado, el algoritmo puede centrarse más en los productos o tiendas con mayor volumen de ventas.
No encontramos la forma perfecta de abordar este reto, pero observamos algunas mejoras agrupando nuestros productos/tiendas por familias o frecuencia de venta.
Una de las ventajas de entrenar múltiples algoritmos son:
- Más rápido de entrenar
- Más fácil de afinar
- Más fácil de depurar
- En caso de anomalías data no todos los modelos irán mal
- Dependiendo de los productos, puede jugar con la función de pérdida y promover la escasez o la sobreproducción
Pero, por otro lado, ¡será más difícil de mantener!
Al final decidimos optar por este enfoque, ya que estaba dando mejores resultados.
¿Cómo evaluar nuestro modelo?
En las secciones anteriores hemos hablado de muchos modelos y de sus prestaciones. Pero, ¿cómo se evalúa un algoritmo de previsión? Obviamente, es muy similar a cualquier problema de aprendizaje automático, pero sin embargo tiene sus propias especificidades:
- Validación cruzada
Como ya se ha mencionado, uno de los retos de la previsión de series temporales es evitar la fuga de data. Puede ocurrir mientras creamos nuestras características: rezagos, normalización de nuestras variables, etc...
Pero también puede ocurrir al realizar la validación cruzada, dividida entre los conjuntos data de entrenamiento, validación y prueba.
No puede utilizar el clásico entrenar_prueba_split() de sklearn. ¿Por qué? ¡Imagine que su conjunto data son las ventas de 2019, si divide aleatoriamente, entrenará sobre data de enero, febrero, ..., diciembre de 2019 y su data de prueba tendrá ventas de las mismas fechas! Como resultado, su algoritmo se entrenará en patrones que no tendrá en producción, de ahí un problema de fuga de data. Para resolver eso hay otras formas de dividir su data como la función TimeSeriesSplit() también de sklearn.
2. La elección de la métrica:
La previsión de series temporales es un problema de regresión, como resultado podemos utilizar las métricas clásicas como MSE, RMSE pero también existen otras, aquí una lista no exhaustiva:
- MAPE o precisión de las previsiones
- Un MAPE ponderado
- Deformación temporal dinámica
Optimizamos nuestro algoritmo utilizando el RMSE, pero para comunicarnos con nuestros empresarios utilizamos una Precisión de Previsión ponderada:

Lo calculamos primero a nivel de día/tienda y luego lo agregamos por tienda utilizando una media ponderada, siendo las ponderaciones las ventas por día de las diferentes tiendas. Evidentemente, esta métrica puede ser cuestionada, pero tiene la ventaja de disponer de un valor para cada tienda, y si un día el gestor rinde realmente (mal o bien) no se sobreestima. Además FA es una métrica realmente interpretable que habla del negocio a diferencia de RMSE.
Por último, otra métrica interesante a tener en cuenta es el biais, que introduce la tendencia general del algoritmo a predecir en exceso o a predecir en defecto. Dependiendo del caso de negocio puede que quiera impulsar una u otra. En nuestro caso impulsamos una ligera sobrepredicción para asegurarnos de tener el producto en la estantería y ¡mantener contento a nuestro cliente!
Palabras finales, algunos consejos para cualquier proyecto data
He pensado que también estaría bien compartir con ustedes algunos consejos, errores que cometemos a nivel de proyecto.
En primer lugar, ¿cómo desarrollamos nuestros modelos, la ingeniería de características?
Todos estos diferentes pasos, experimentos se realizaron en cuadernos, ¡pero el uso de cuadernos no significa código sucio! Al contrario, recomendamos encarecidamente tomarse el tiempo necesario para escribir cuadernos adecuados con títulos, nombres propios, funciones y factorizar las líneas redundantes.
El uso de cuadernos plantea algunos retos, especialmente cuando muchos desarrolladores trabajan juntos: conflictos en github, código no replicable, etc...
He aquí algunos consejos para reducir estos problemas:
- Versione sus cuadernos utilizando rebajas
- Evite trabajar juntos en los mismos cuadernos
- Si todavía lo hace, para manejar los conflictos en el cuaderno utilice la función nbdev biblioteca de fastai
- Empaquete las funciones comunes en archivos .py como resultado todo el mundo utilizará las mismas
- Para versionar su experimento utilice herramientas como Flujo ML
- Evite print() y utilice un registrador en su lugar, sólo registre la información útil. Compruebe scikit-lego que tiene características muy interesantes, decoradores.
- Si realmente quiere imprimir cosas pruebe en la biblioteca rico que lo hace más agradable y también puede utilizarse como herramienta de registro. Aquí a demostración rápida de ricos por calmcode.io
Puntos clave
Nos hubiera encantado compartir con ustedes nuestros resultados, pero no se nos permitió por motivos de privacidad, pero podemos decir que con esta metodología pudimos hacerlo:
- Sea tan bueno como su mejor planificador de la demanda
- Aumente la FA de alguna tienda hasta 30%
Pero por otro lado, aquí está la lista de nuestros mayores aprendizajes que espero le ayuden a desarrollar su propia solución:
- Tómese el tiempo necesario para comprender su problema, defina un objetivo claro y medible, una métrica de evaluación
- Cruce y explore su data, si no ha encontrado anomalías... ¡no ha mirado lo suficiente!
- Realice un seguimiento riguroso de sus experimentos
- Escriba código limpio especialmente en cuadernos, le facilitará mucho la vida para la implantación
- Piense siempre en la producción, las fugas data son su peor enemigo en la previsión de series temporales
- Empiece con un ámbito pequeño, con modelos sencillos, pruebe, falle, aprenda, mejore y ¡tenga éxito!